A 506(c) Investment Opportunity

Canvas: Premium Master-Planned Community in the San Antonio–New Braunfels Hypergrowth Corridor

Project Visual Board 01-A

Canvas is an institutional-grade, master-planned land development project strategically located within the hyper-growing San Antonio–New Braunfels expansion corridor. The project is spearheaded by Red Oak Development Group, a premier sponsor team leveraging 17 years of regional experience in master-planned development.

Built for investors seeking asymmetric upside and portfolio diversification, Canvas delivers a premier opportunity for investment with a highly professional sponsor team with a proven 17-year regional track record.

Sponsor Origins & Operating Vision

Who is
Red Oak Development Group?

Red Oak Development Group

We craft communities for people, and spaces where life happens - places where kids walk to the corner store and the energy of life being lived is felt on the town green.

Red Oak Development Group obsesses the nuances and designs the smallest details of a community, with the intent of creating places that make life better for people. Every Red Oak community has its own story, and each is as unique as the people who call it home or start their business there.

We create complete communities where homes, retail, commercial, schools and civic spaces are integrated from the start - generating a better quality of life for residents and durable economic fundamentals for investors.

We define success by what matters to people: life per square foot over price per square foot, happiness indexes, wellness metrics, and social connectivity. We do all of this with the confidence that doing the right thing for people generates solid returns for our investors, partners, and the greater communities themselves.

Firm Snapshot

Discipline
Master-Planned Communities
Focus
Texas Growth Corridors
Year Founded
2010
Founder
Tom Staub
Capital Base
Private Long-Term Investors
Asset Mix
Land · Residential · Commercial

Leadership Team

TS

Tom Staub

Chief Executive Officer

Oversees Red Oak's vision, expansion strategy, underwriting, and financial planning. 15+ years in real estate spanning single-family, multifamily syndications, and flex industrial - focused on master-planned community development since 2019. Previously spent 12 years in corporate finance for Fortune 10 companies and Silicon Valley unicorns. Founder of TEACH (Teacher's Economic Advancement through Community Homeownership).


DT

David Teo

Partner

Leads capital strategy, investor relations, strategic partnerships, underwriting, and legal/tax compliance. Structures investment models that minimize risk and optimize returns. Also CEO of Centauri Capital Group, managing a $400M+ portfolio across multifamily, medical office, and land. Board Director of the Greater Austin Asian Chamber of Commerce.

MM

Mike Miller

EVP, Real Estate & Community Development

Directs strategic planning and execution across every Red Oak community - development agreements, public finance, builder partnerships, CCRs, architecture guidelines, HOA formation, and entitlements. Former SVP at Signorelli Company where he launched 4,700-acre Austin Point and 3,000-acre Firefly. Master's in Real Estate Development from Texas A&M.

In the Field

Red Oak, shifting how development gets done

Tom Staub on panel at 2025 New Home Trends Summit with John Burns Research & Consulting
Red Oak principal speaking on industry panel
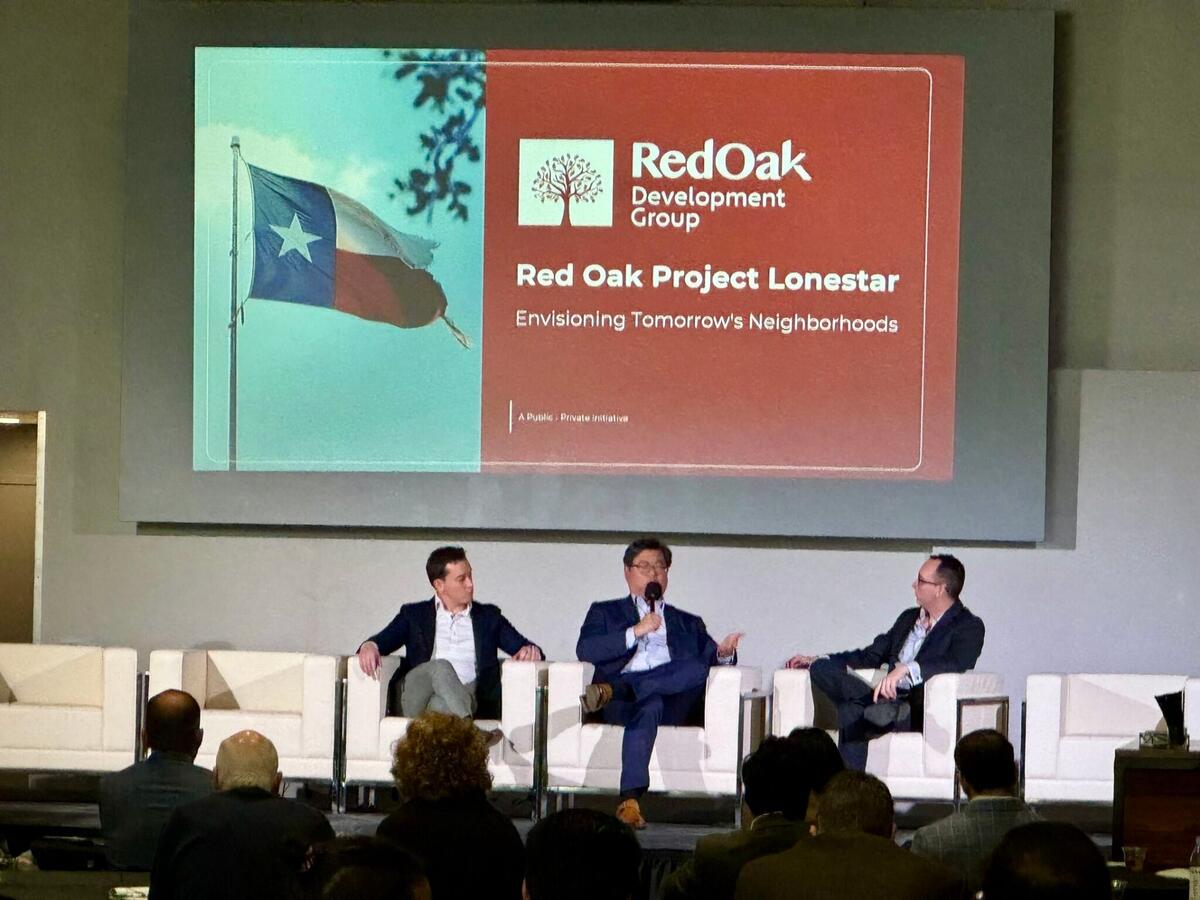
Red Oak Project Lonestar - Envisioning Tomorrow's Neighborhoods panel
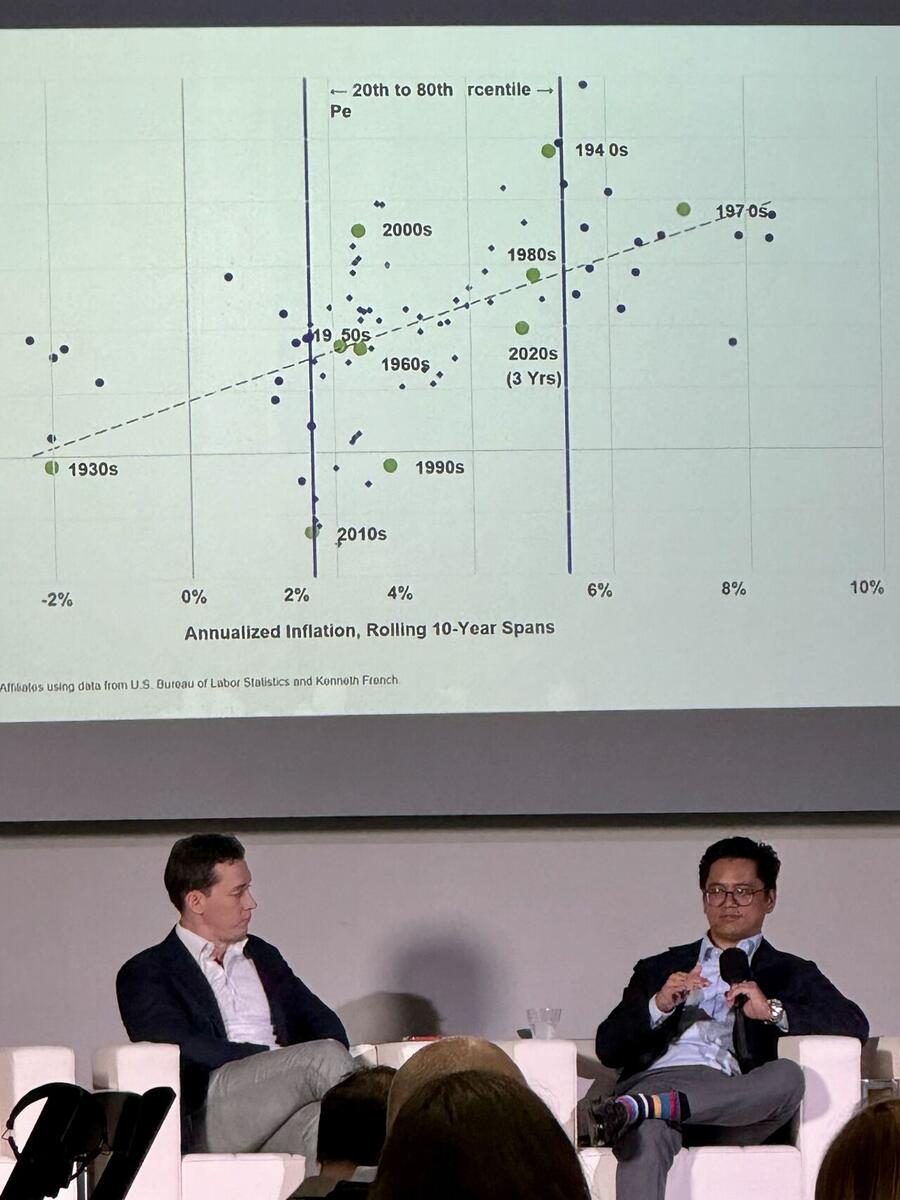
Panel discussion on inflation cycles and real estate investing
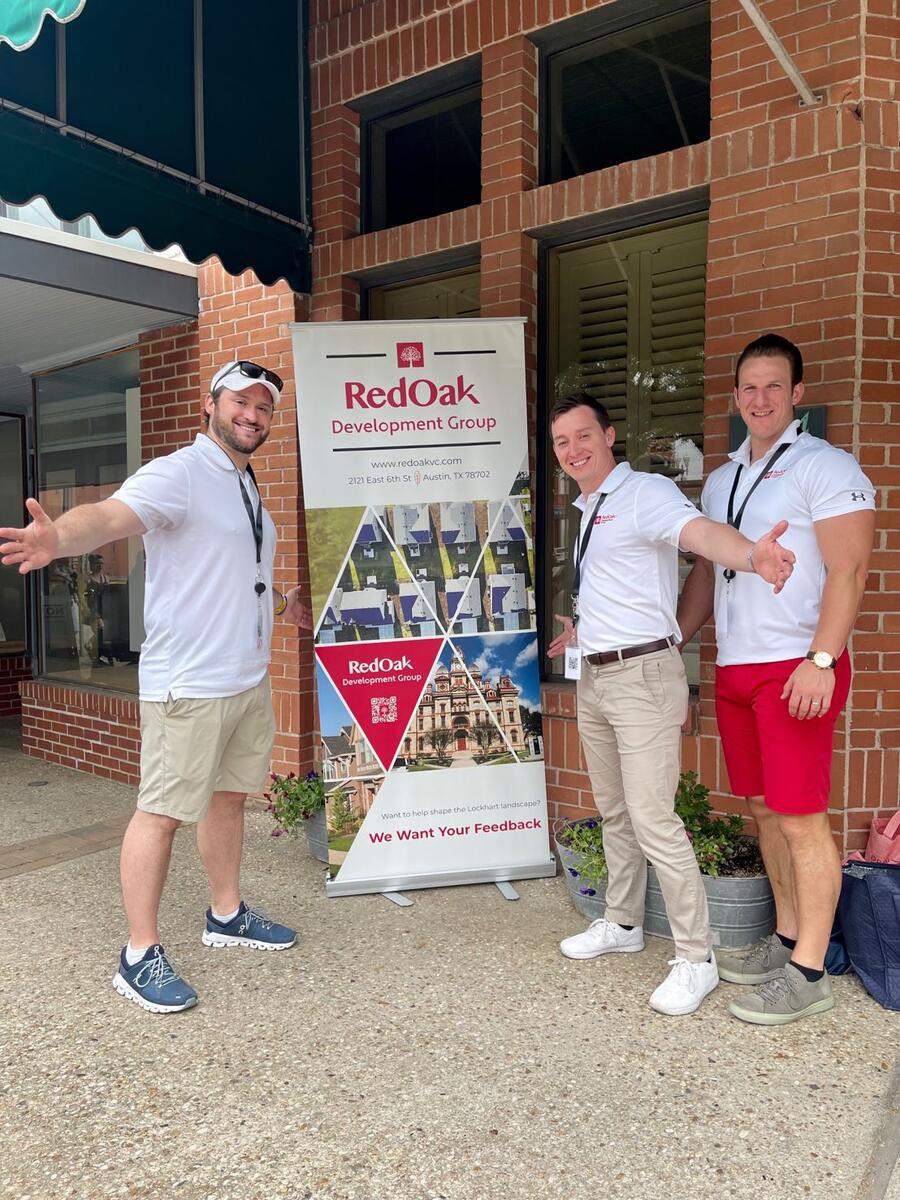
Red Oak team on site at Lockhart community outreach

Sponsor Track Record

Project examples

01 · Flagstaff, AZ

Pinehaven

Luxury Residential Community

83 Units

Red Oak delivered the entire community end-to-end - horizontal infrastructure, road network, and vertical home construction across an 83-unit luxury enclave nestled in the Flagstaff pines.

02 · Lockhart, TX

Moxie

Master-Planned Community

2,500 Homes · 589 Acres · 2 Schools

A 589-acre master-planned community delivering 2,500 homes alongside two integrated school campuses - a complete neighborhood built from the ground up along the Central Texas growth corridor.

03 · Temple, TX

Pepper Creek

Retail Community

Mixed-Use Retail Center

A ground-up retail destination anchoring the Temple, Texas trade area - designed around walkable storefronts, durable tenancy, and the everyday rhythms of the surrounding community.

Investor Testimonials

Words from Investors across prior projects.

300+

Active Investors

2014

1st Investor Invested

$35M+

Total Capital Deployed

$50M+

Projected by 2026

Leadership was responsive and transparent. They went ahead of the curve and were smart on managing my investment and exit strategy. Completely satisfied with their communication and interested in investing in more deals.

- Dianna Wilusz

I was impressed with the team's ability to pivot as market dynamics changed to ensure a successful exit. Good risk management and I appreciated the execution and transparency. 5 out of 5.

- Dahlia Frydman

The management team was accessible, honest, transparent and trustworthy. They provided clear data driven communication, high responsiveness, and willingness to explain items during my investment cycle. Will invest again.

- Clarissa Wu

Investment Offering

Investment Classes

Class D - 1

Entry tier

Min. Inv.$100K
Pref. Return8.0%
Profit Share12%
Equity Mult.2.34x$100K → $234K
IRR23.0%

Class D - 2

Preferred tier

Min. Inv.$250K
Pref. Return10.0%
Profit Share14%
Equity Mult.2.58x$250K → $645K
IRR26.2%

Class D - 3

Premium tier

Min. Inv.$500K
Pref. Return12.0%
Profit Share15%
Equity Mult.2.74x$500K → $1.37M
IRR28.2%

Model your allocation.

Adjust your check size to see your year-by-year distribution waterfall, equity multiple, and projected IRR.

$
$100K min$6M max
Assigned TierClass D - 2

Pref. Return

10.0%

Profit Share

14%

Total Distributions

$645,952

on $250,000 invested

Profit

$395,952

10.0% pref + 14% share

Equity Multiple

2.58x

Projected IRR

26.2%

2028

Total Distributions

$81,008

Capital Paid Back

$31,352

Preferred Returns

$9,845

Profit Share

$39,811

MOIC / IRR

0.32x · -43.1%

2029

Total Distributions

$156,015

Capital Paid Back

$60,382

Preferred Returns

$18,960

Profit Share

$76,673

MOIC / IRR

0.95x · -2.0%

2030

Total Distributions

$108,684

Capital Paid Back

$42,063

Preferred Returns

$13,208

Profit Share

$53,412

MOIC / IRR

1.38x · 11.2%

2031

Total Distributions

$123,525

Capital Paid Back

$47,807

Preferred Returns

$15,012

Profit Share

$60,705

MOIC / IRR

1.88x · 19.8%

2032

Total Distributions

$121,746

Capital Paid Back

$47,119

Preferred Returns

$14,796

Profit Share

$59,831

MOIC / IRR

2.36x · 24.8%

2033

Total Distributions

$42,993

Capital Paid Back

$16,639

Preferred Returns

$5,225

Profit Share

$21,129

MOIC / IRR

2.54x · 26.0%

2034

Total Distributions

$5,810

Capital Paid Back

$2,249

Preferred Returns

$706

Profit Share

$2,855

MOIC / IRR

2.56x · 26.1%

2035

Total Distributions

$6,171

Capital Paid Back

$2,388

Preferred Returns

$750

Profit Share

$3,033

MOIC / IRR

2.58x · 26.2%

Total

Total Distributions

$645,952

Capital Paid Back

$250,000

Preferred Returns

$78,502

Profit Share

$317,449

Equity Multiple

2.58x

Projected IRR

26.2%

Projections based on sponsor underwriting for the CANVAS land subdivision placement. Distributions, MOIC, and IRR scale linearly within tier; tier assignment changes terms at $250K and $500K thresholds. Figures are estimates, not guarantees.

The Masterplan

Canvas: A community built and designed around parks, landscape, and amenities

Canvas masterplan

Canvas · Tailored Allocation Briefing

A Tailored Offering. A Proven Team. Located in a Hypergrowth Corridor of Texas

Launch 12-Minute Regional Macro Analysis

Sponsor Track Record · Submarket Allocation · Infrastructure Inflows

Secure Stream
12:04 · 1080p · Watermarked

Supplemental Briefing Reel

Four short deep-dives from the sponsor team

Macro Thesis · 2026–2031

Domestic and Foreign Capital is rotating into U.S. corridors where population, jobs, and development compound simultaneously.

01

Demographic Tailwind

The San Antonio–New Braunfels MSA is absorbing migration from coastal metros at a pace that outstrips housing delivery by ~2.4×. Household formation is structural, not cyclical.

02

Employer Anchoring

Defense, semiconductors, advanced manufacturing, and logistics are committing multi-decade capex inside a 60-mile radius - converting transient growth into durable demand.

03

Land Scarcity at the Path of Growth

Entitled, infrastructure-ready acreage along the I-35 spine is being absorbed faster than it can be replaced. Basis matters more in the next cycle than in the last.

Interactive · Market Highlights

The data behind the thesis

01 / 04

+1,100 / wk

Net In-Migration

Texas absorbs more new residents than any other state

San Antonio–New Braunfels ranks among the top 5 fastest-growing MSAs in the U.S., with sustained inbound migration from California, Illinois, and the Northeast.

Source · U.S. Census · Texas Demographic Center

Positioned in the path of Texas hypergrowth.

Central Texas · Austin–San Antonio Corridor

5mi / 10mi Radii

N05 MI10 MII-35 Corridor~120K daily · ~44M/yrI-10 Spur~65K daily · ~24M/yrSH-130 Bypass~28K daily · ~10M/yrUS-90TX-123AustinSTATE CAPITALSan AntonioMETRO CORENew BraunfelsCORRIDOR ANCHORSan MarcosKyleSeguinLulingGonzalesCiboloBoerneFloresville5 MI10 MISITE
I-35 CorridorI-10 SpurSH-130 Bypass

MSA Growth · Jobs · Population · GDP

Job growth - nonfarm payroll employment (indexed, 2010 = 100)

BLS State & Metro Area Employment · SA–NB MSA vs U.S. · 2010–2024

SA–NB MSA United States
9510511512513514520102012201420162018202020222024

Source: U.S. Bureau of Labor Statistics (BLS), All Employees: Total Nonfarm, FRED series SMU48417000000000001A (SA MSA) and PAYEMS (US). Annual averages, not seasonally adjusted.

SA MSA jobs 2010

855,000

SA MSA jobs 2024

1,182,800

SA MSA total growth

+38.3%

US total growth

+21.8%

Population growth (indexed, 2010 = 100)

U.S. Census Bureau · SA–NB MSA vs U.S. · 2010–2024

SA–NB MSA United States
9810511211812513220102012201420162018202020222024

Source: U.S. Census Bureau, Annual Population Estimates; FRED series SATPOP (SA MSA). 2010 from decennial census. 2025 MSA estimate: 2.81M.

SA MSA pop. 2010

2.14M

SA MSA pop. 2024

2.76M

SA MSA total growth

+28.9%

US total growth

+9.9%

GDP growth - nominal current dollars (indexed, 2010 = 100)

Bureau of Economic Analysis (BEA) · SA–NB MSA vs U.S. · 2010–2023

SA–NB MSA United States
9512114717319922520102012201420162018202020222023

Source: BEA, GDP by Metropolitan Area; FRED series NGMP41700 (SA MSA). Nominal (current-dollar) GDP - includes inflation. Latest MSA data available is 2023. SA MSA 2010 GDP interpolated from BEA/proximityone data (~$87.5B in 2011 at ~5% YoY growth).

SA MSA GDP 2010

~$83B

SA MSA GDP 2023

$182B

SA MSA total growth

+119%

US total growth

+82.9%

Master-Planned Communities · Performance Evidence

Why Master Planned Communities outperform subdivisions & the broader market.

Three decades of independent research - RCLCO, Zonda, John Burns, and the Urban Land Institute - converge on the same conclusion: master-planned communities sell faster, command higher lot and home prices, and hold value through housing cycles. The Canvas program is underwritten to those structural advantages, not to a speculative thesis.

+10%

Home price premium over comparable subdivision homes

+22%

Average lot price premium vs. non-planned developments

+50%

Higher sales pace in amenity-rich MPCs vs. subdivisions

30 yr

Consecutive years of MPC outperformance tracked by RCLCO

Monthly sales pace - MPC vs. subdivision

Homes sold per month, national average · Zonda Master Plan Outlook

Master-planned community
Typical subdivision

Price tier sales pace - high-end detached homes

MPC sales pace advantage at price bands · Zonda, 2024

Market resilience - top 50 MPCs vs. national new-home market (index)

Annual new home sales, indexed to 2022 baseline = 100 · RCLCO / John Burns Research

Top 50 master-planned communities
National new-home market

Underwriting Takeaway

MPCs don’t just sell more homes - they sell them faster, at higher per-lot values, and with markedly less volatility through downturns. Canvas is structured to capture each of those premiums in the lot-and-amenity layer, where the spread between MPC and conventional product is widest.

Canvas Masterplan

Red Oak's Commercial Concept

The Junction - The Retail Village Center

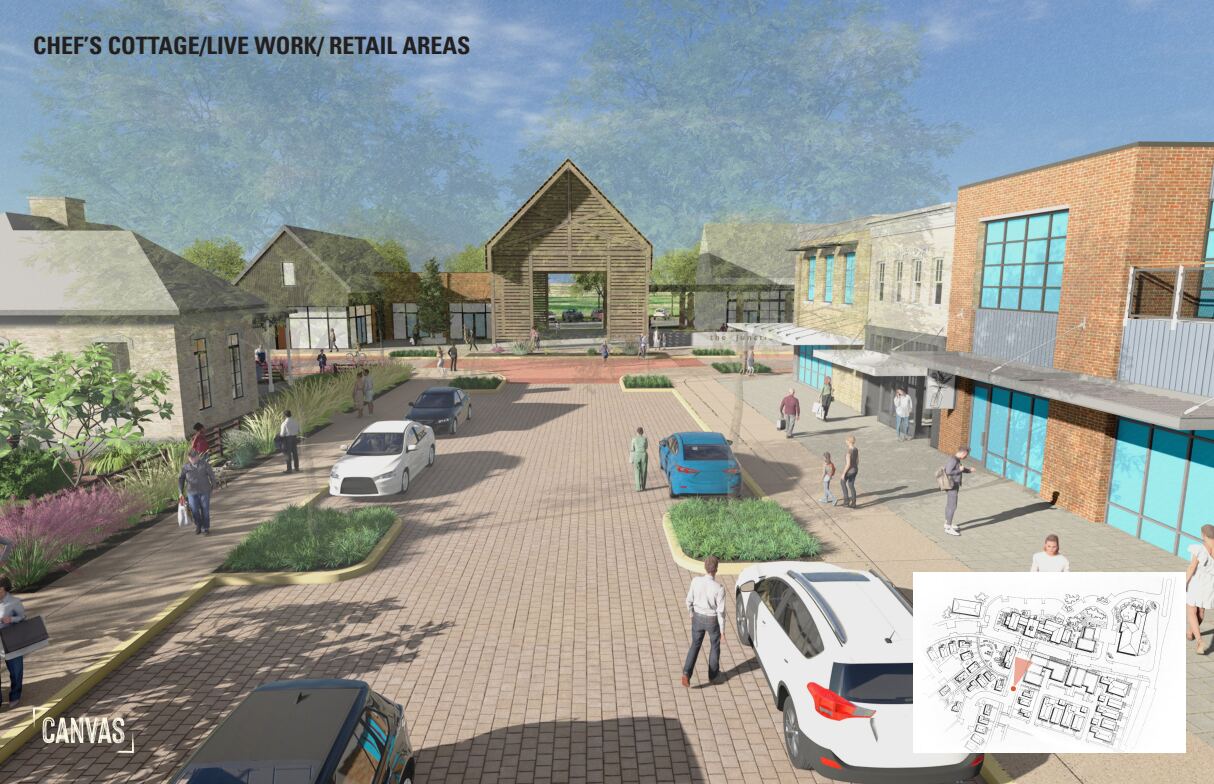
A walkable mixed-use heart that brings chef-driven retail, live-work frontage, a food hall, and cottage-scaled programming into the center of the community. The concept is designed to create daily foot traffic, lifestyle identity, and a true sense of place rather than a conventional strip-center edge condition.

Concept Narrative

A commercial main street sized to the community - and shaped around experience.

The Junction is conceived as a compact commercial district where residents can walk to coffee, retail, dining, and community gathering spaces from within the master plan. It is less about maximizing pad count and more about composing a memorable, differentiated center that supports both placemaking and long-term value.

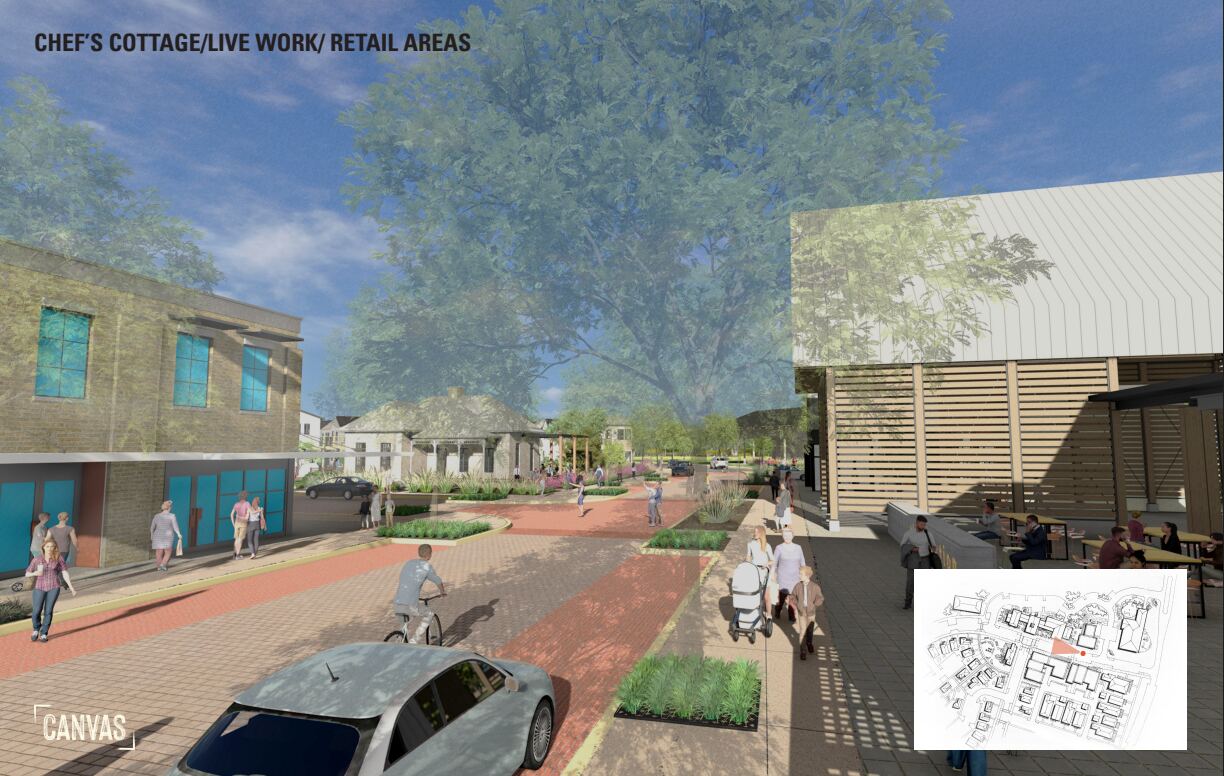
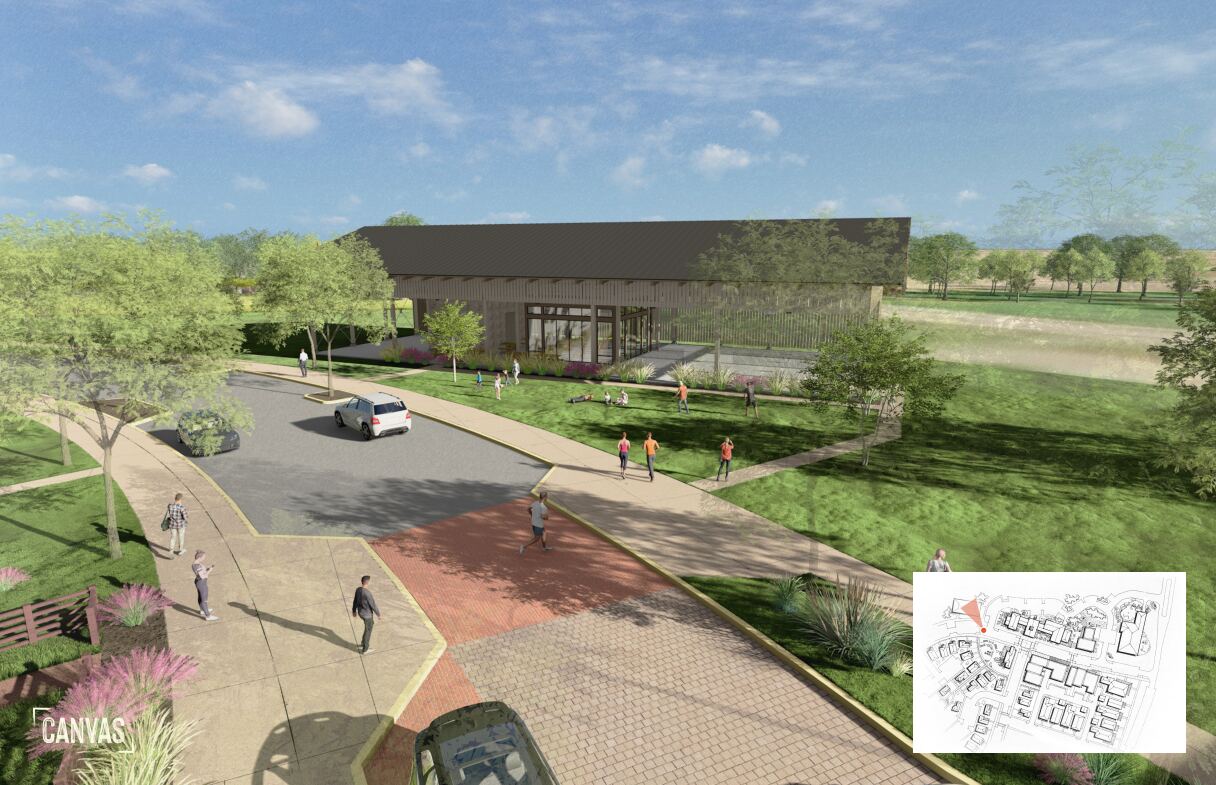
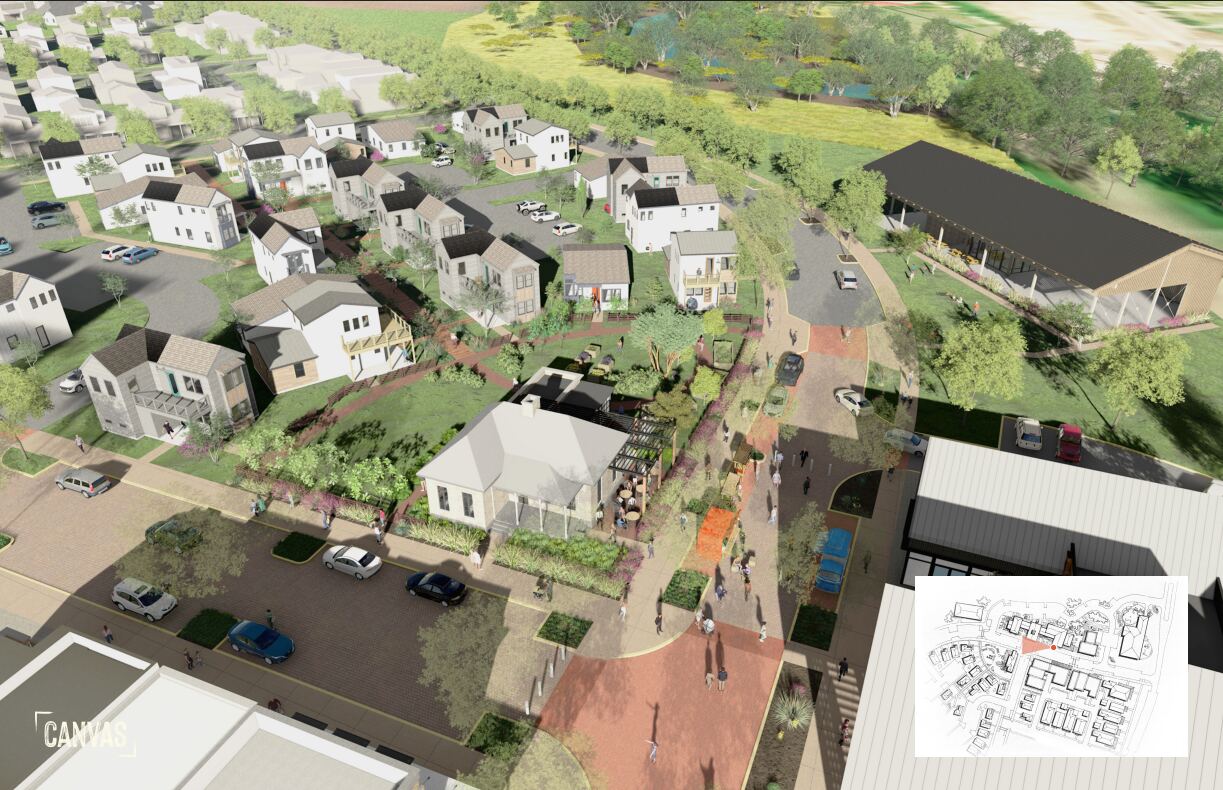
The renderings show multiple scales of activation: a chef's cottage and garden, live-work frontage, a food hall pavilion, and a flexible central plaza that can host daily use as well as programmed events. This format reinforces the broader Red Oak philosophy of complete communities with meaningful civic and social life built in from day one.

Retail Street Perspective
Ground-level view through the chef's cottage, retail frontage, shaded seating, and pedestrian realm.
The Junction Plaza
A central commercial square framed by scaled storefronts and a signature gateway structure.
Food Hall Edge
The food hall pavilion anchors the creekside edge with walkable frontage and open lawn.
Chef's Cottage District
The chef's cottage, garden, and commercial frontage integrate directly into the residential fabric.
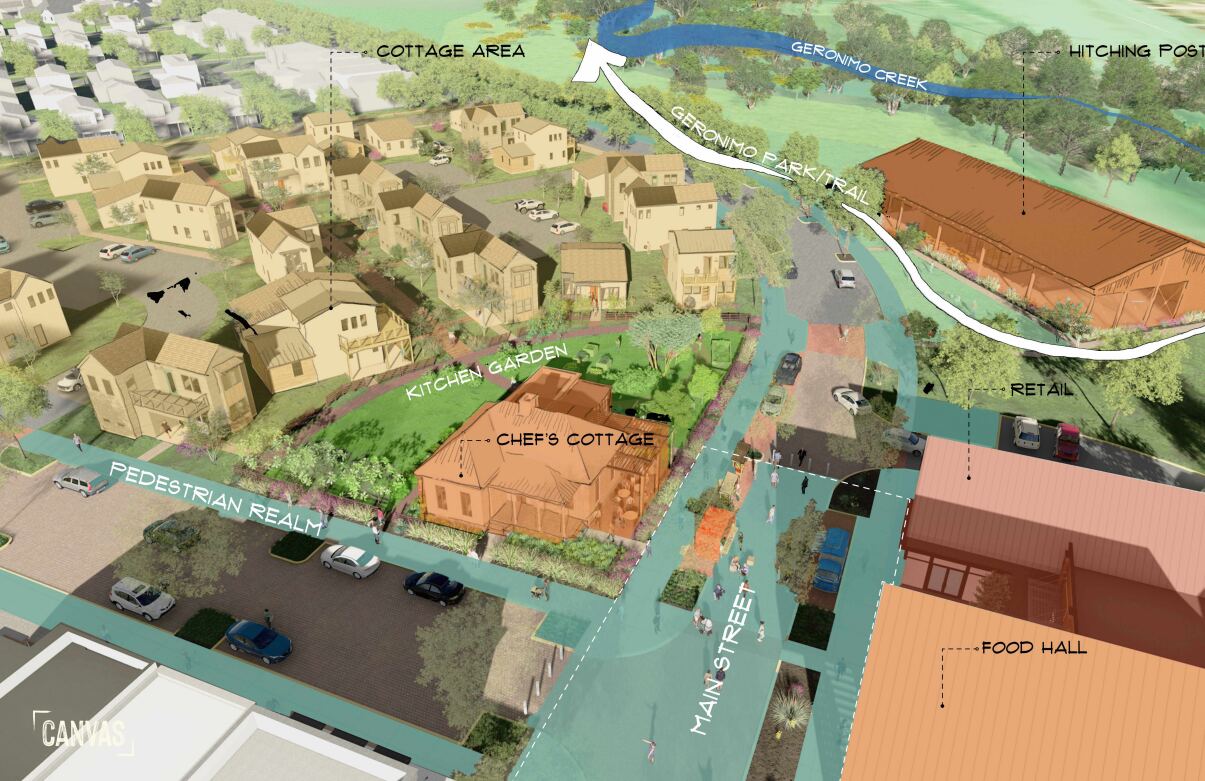
Concept Diagram
Annotated site diagram showing the pedestrian realm, main street, retail, food hall, and trail connection.

Market Validation

Consumer Priorities in Master-Planned Communities

The following rankings are based on current market research, highlighting what modern buyers value most when selecting a master-planned community.

1

Walkability & Access

60% of buyers prioritize communities where retail, dining, and daily services are within walking distance.

2

Outdoor Lifestyle

Access to parks, trails, and functional outdoor spaces now outranks interior square footage for many buyers.

3

Community Connectivity

Strong preference for "third places" like cafes and social gathering hubs to foster neighborhood cohesion.

4

Modern Amenity Suites

Demand is high for active, low-maintenance recreational features such as pickleball courts, pools, and fitness centers.

5

Safety & Cohesion

Consistent architectural standards and well-maintained landscapes serve as key indicators of future resale value.

Market Demographics & Buyer Profiles

Buyer Profiles & Market Research.

Independent demand research from John Burns Research & Consulting (JBREC) and Kantar MindBase, modeled against the Seguin / East Seguin / West Seguin / San Antonio MSA submarkets. Below is the underwriting view of who buys here, what they earn, what they want from a home, and which product types deliver to them.

779K+

Qualified Households (4-mkt)

20–24%

Millennial Ambitious Realists

$75K–$125K

Median HHI Targets

01 · Executive Summary

Four buyer cohorts.

Gen Z Engaged Activists, Millennial Ambitious Realists, Xer Homefront Heroes, and Xer Pragmatic Pathfinders form the core demand pool across Seguin, East/West Seguin, and the San Antonio MSA. Underwriting prioritizes Millennials and Xers - the cohorts in life stages that drive home purchase (marriage, family formation, aging-in-place).

JBREC Executive Summary · Buyer cohort traits, income, market size, and home expectations

03 · Core Product Types by Buyer Segment

What gets built - and who buys it.

JBREC recommends an array of conventional product complemented by a 35′ cottage and a 40′ alley-loaded home. Primary subject segments - Young Families and Mature Singles & Couples - anchor the absorption curve with 40′–50′ detached lots and low-maintenance first-floor primary cottages.

JBREC · Product type recommendations matched to buyer segments and price points

Current Funding Window
$5,830,000 raisedof $12,000,000
$6,170,000RemainingRed Oak Co-Invest · 10%

Reserve Your Allocation

A private 1-on-1 with the Managing Principal to confirm fit, walk the co-investment terms, and tailor your allocation in the current funding window. Minimum check: $50,000.

Select Appointment Time

Scheduler not loading? Open Calendly directly

30-Minute Call Agenda

  1. 01

    Deal Overview & Macro Submarket Strategy

    10 min

    • -Breakdown of the 352-acre Planned Development (PD) masterplan.
    • -Analysis of local employment density insulation driven by major logistical hubs like Amazon and Walmart, alongside pipeline intake demand from premier national homebuilders (Highland, Perry, Drees, Toll Brothers).
  2. 02

    Sponsorship Team, Management & Co-Investment Alignment

    5 min

    • -Deep-dive on Red Oak's operating track record: a nearly 5,000-homesite portfolio delivered across Central Texas land development programs.
    • -Review of Red Oak's execution discipline - entitlement sequencing, municipal engineering, and finished-lot delivery cadence to national homebuilders at institutional scale.
  3. 03

    Project Approvals & Risk Protections

    5 min

    • -City Approvals: A clear look at the final city votes, Planning & Zoning steps, and utility approvals needed to start building.
    • -Safety Cushions: How we protect your money against rising prices with a built-in 10% emergency fund for construction, a 7% cushion for soft costs, and a 4% yearly buffer for inflation.
  4. 04

    How Profits Work & Funding Steps

    10 min

    • -Profit Sharing: A walk-through of the profit sharing structure designed in favor of equity investors.
    • -Funding & Security: A quick guide on how to safely verify your investor status and securely wire your funds through our private portal.
Conducted under mutual NDA. Encrypted dial-in only.

Canvas is a private Regulation D Rule 506(c) offering. All scheduled interviews are conducted under NDA. Past performance is not indicative of future results.

Investor Due Diligence

Operational &
Execution FAQ

Capital Structure & Subscription

Investor Reference & Disclosures

Our private placements are conducted under Regulation D, Rule 506(c), and are limited to verified accredited investors as defined by the SEC. Verification is completed prior to subscription via third-party documentation review or a qualified letter from a CPA, attorney, or registered investment advisor.

Minimum commitments vary by vehicle and project phase. Most active offerings carry a minimum of $100,000 per LP interest, with select co-invest opportunities structured at higher thresholds. Specific terms are disclosed in the Private Placement Memorandum delivered after the allocation review.

The general partners and principals co-invest meaningful capital alongside every passive LP commitment. We do not market projects we do not heavily back with our own balance sheet. Co-invest percentages, distribution waterfalls, and promote structures are disclosed transparently in the offering documents.

Master-planned community developments are inherently illiquid. Target hold periods typically range from 5 to 8 years from initial close through final lot sellout, with interim distributions tied to phased land sales and entitlement milestones. These are long-duration, private real estate investments - not liquid securities.

Yes. Every allocation review is conducted one-on-one with a Managing Partner - not an outsourced sales representative. Ongoing investor communications, quarterly reporting, and capital event discussions all flow through principal-attended channels.

No. The information presented on this site is for general informational purposes only and does not constitute an offer to sell or a solicitation to buy any security. Any offer is made solely through definitive offering documents delivered to verified accredited investors under a mutual non-disclosure agreement.

Land Acquisition & Regional Infrastructure

Site Footprint & Aggregation Strategy

  • The Canvas development comprises a comprehensive 352-acre Planned Development (PD) property site footprint.
  • The acreage aggregation schedule is divided into three chronological gates: an initial 80-acre parcel is currently fully owned by the partnership, a secondary 122-acre tract (containing roughly 5 acres of commercial-zoned space) closes in July 2026, and the final 150-acre master expansion tract closes in December 2027.
  • Day-to-day land development operations, municipal engineering coordination, and site execution are entirely managed by Red Oak.
  • The community design features pristine natural asset borders along Geronimo Creek and sits directly adjacent to the active campus footprint of the Navarro Independent School District.
  • Regional connectivity is driven by direct proximity to Hwy 123, Interstate 35, Interstate 10, and State Highway 130.

Entitlement Timelines & Milestones

Municipal Gates & Construction Schedule

  • Ongoing municipal steps throughout mid-2026 focus on resubmitting the official Development Agreement (DA), negotiating a 60% Tax Increment Reinvestment Zone (TIRZ) city contribution, and finalizing street, parks, traffic, and wastewater design maps.
  • Formal homebuilder purchase contract signatures are targeted for Q3 and Q4 of 2026, with builder Earnest Money Deposits (EMDs) scheduled to transition to non-refundable hard status in Q1 of 2027.
  • Engineering grading permits and final construction plans wrap up between August and February, with physical site construction and development financing actively kicking off in March 2027.

Product Inventory & Consumer Targeting

Builder Pipeline & Lot Mix

  • Active pipeline lot interest has been established from premier regional and national production builders: Highland Homes, Drees Homes, Perry Homes, Toll Brothers, David Weekley Homes, and Coventry Homes.
  • Core Volume Product - heavily weighted toward 50' lots comprising 44% of total inventory, supplemented by 60' move-up lots comprising 20%.
  • Attainable High-Density Product - 40' conventional lots making up 16% of the layout, alongside 40' alley-loaded units making up 10%.
  • Premium Luxury Product - larger 70' executive lots at 5% and signature 80' estate lots at 4% of total site counts.
  • Young Families (Primary Segment) - single-family conventional homes on 40' and 50' lots that balance family spatial needs with regional income brackets.
  • Mature Singles & Couples (Primary Segment) - low-maintenance detached cottages and smaller 45' lots tailored for local downsizers.
  • Young Singles & Couples / Mature Families - higher-density 40' alley-loaded cottage product lines or expansive move-up designs on 50' to 60' wide lots.

Process & Diligence

Engaging With Our Team

Every deal clears a rigorous internal diligence matrix covering demographic trends, infrastructure commitments, municipal entitlement risk, environmental resilience, and builder absorption. We maintain conservative debt coverage ratios and structure development agreements to insulate LP capital from horizontal construction overruns.

You'll receive a calendar confirmation and a pre-meeting brief covering the current development footprint and available capacity. During the call we walk through the structural terms, answer diligence questions, and - if there's mutual fit - initiate accreditation verification and PPM delivery.